Deconstructing the Cantor's set theory |
|
| The purpose of this series is to explore the dynamic of a fractal phenomenon interacting with elements of optical illusion from the perspective of the Visual Arts. | |
I - THE MATHEMATICAL GRID |
|
|
|
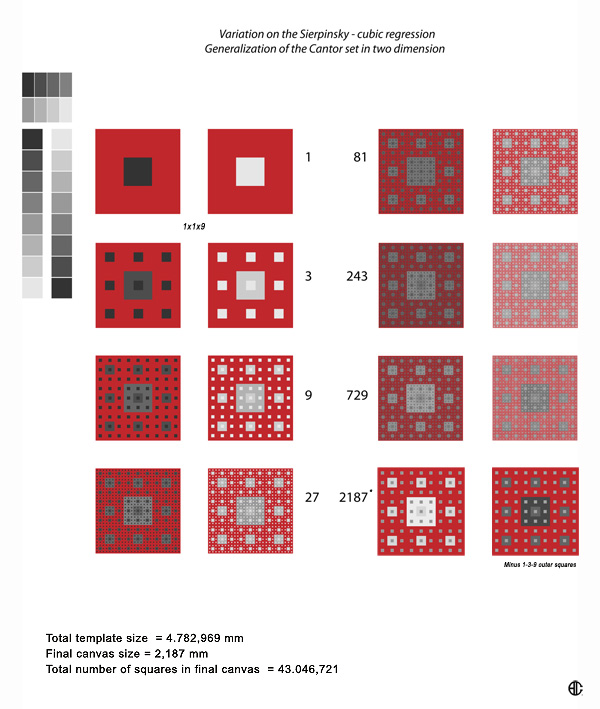
| The Sierpinski square fractal grid requires that one starts with a solid square and divide it into 9 smaller congruent squares. The original square is scaled 8 times by a factor 1/3. | |
| The units of measurement units were set following the metric sytem and the progression process reverted, starting with a square figure of 1 millimeter expanded 8 times. (The regressive process would have brought the final square down to 0.000387 m. or 0.01524157902758726 inches) | |
| The total canvas size of the digital file came to 2187 mm or 2, 187 m - which should have been - or so I believed - a more manageable size in practical terms. | |
| I used Adobe Illustrator, version 13.0.2. to draw the grid pattern. This vector graphics application uses mathematical formulae that would insure the best quality image possible within my working environment. | |
| No other application were running. | |
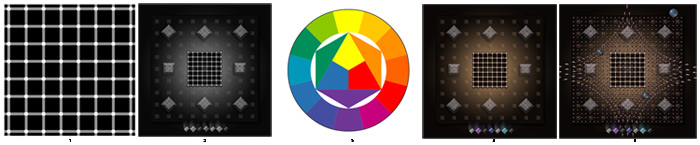
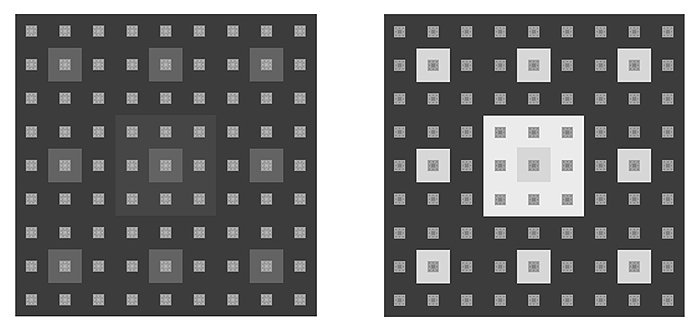
| The initial square – size 1 mm, stroke size 0 - was filled with 80% pure black - followed by 10% increment toward pure white for each progression | (Fig.1) |
| A mirror template was used to revert the fill process and monitor the inverted optical effect. | (Fig.2) |
| Plates 1, – 3, – 9, – 27, – 81, were completed without problem. | |
| Moving to plate 243mm, I started to notice slight changes of x y w h positioning and dimension of the smaller squares, (600.0007 mm turned into 600.009mm in a simple copy paste step) even after locking all elements on plate 81. | (Fig.3) |
| The system started to slow considerably during rendering as I was reformatting and repositioning the elements. | |
| I also noted that the center square of plate 243 (b) filled with 40% black disappeared in the background because of the hue interference of too many squares 1- 3 and 9. | (Fig.4) |
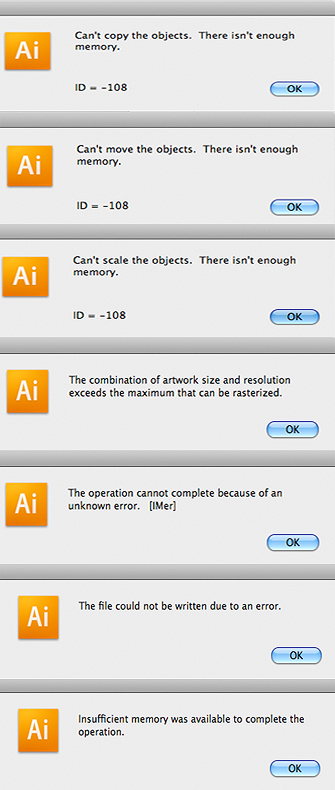
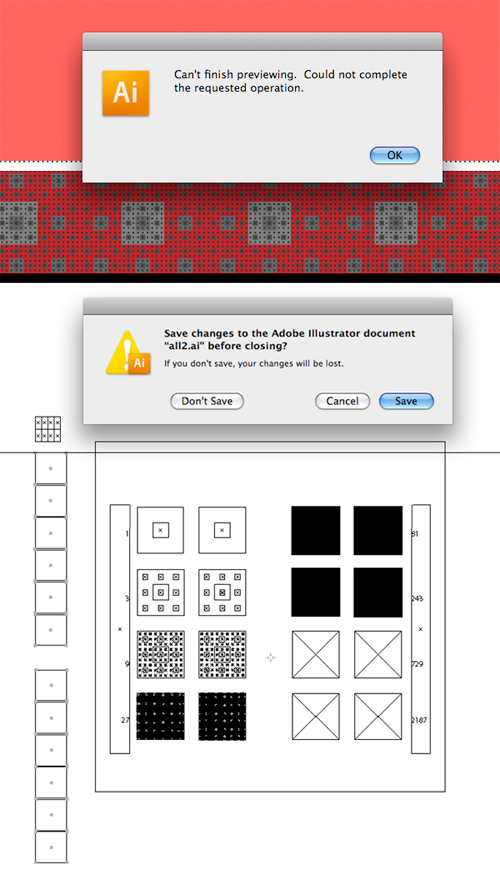
| The computer gave up when I tried to transfer plate 243 mm into the next progression (729 mm) | |
| The following is a brief selection of the numerous pop up windows that came on the screen as I tried every possible combination to either reduce, save, export, convert/rasterize as TIFF, JPG, PNG or PDF) | (Fig.5) |
| Other interesting occurrences happened during some (save as) actions such as a spontaneous degradation of the image. | |
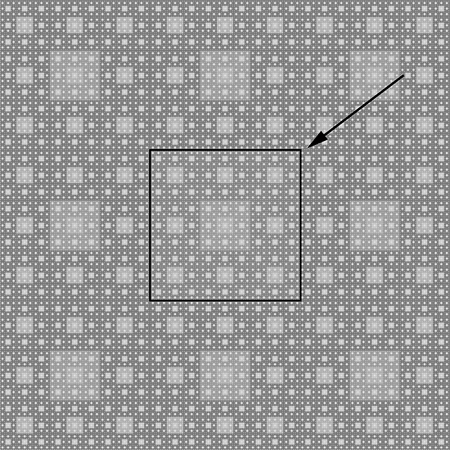
| The image below shows a file preview at saving time, half the existing squares having been wiped out. Closing the window without saving preserves the original image. | (Fig.6) |
| For good measure here is an activities monitor screenshot at the time of the computer’s collapse. | (Fig.7) |
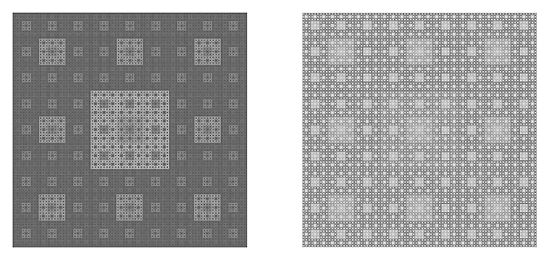
| To be consistent with the premises of the project and bring the progression to 2187, I opted for the only alternative left: a reverse elimination of layers 1, 3, and 9mm. Pushing the computer to its processing limit, I was able to preserve some of the 1-3-9 mm squares in some of the larger squares. | (Fig.8) |
| A quick evaluation of the total numbers of squares needed to complete the Sierpinski fractal shows the extend and limit of the MacPro computation power:
Total template size 2187x2187 = 4.782,969 mm. |
|
| Here is a plate of the complete progression | (Fig.9) |
II – OPTICAL ILLUSION |
|
| I transferred the templates 2187 into Photoshop vs.10.00 and worked in a new canvas, extracting or blending selected elements as needed. | |
| Below is a brief descriptive of the process: | |
|
|
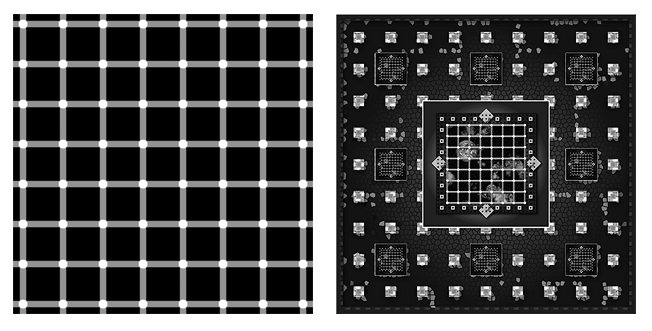
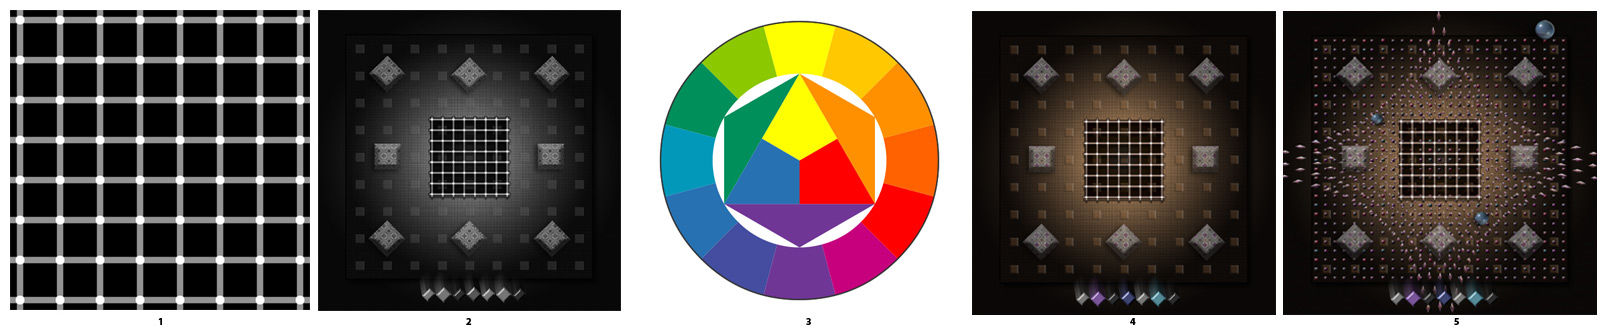
| Dark patches appear in the line crossings, except the ones that you are directly looking at. If you look around in the neighboring figure you will notice the appearance and disappearance of black dots at the crossings. (Invoked to explain Florida’s election problems in 2001: “Count the black dots, recount to confirm…”) |
(Fig.10) |
|
|
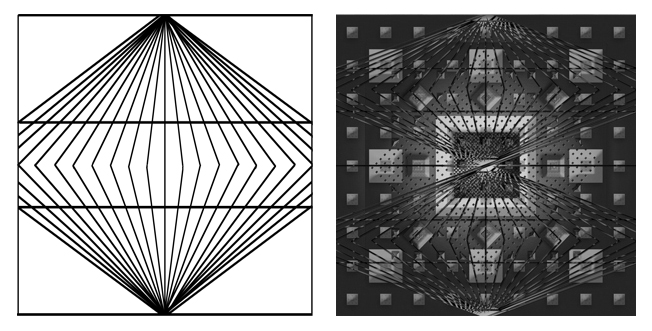
| Discovered in the 19th century by German physiologist Ewald Hering. Two straight lines appear curved or bowed in the context of intersecting lines with orientations that change progressively. Hiding the oblique lines from the view will reveal the fact that the horizontal bars are equally straight. |
(Fig.11) |
|
|
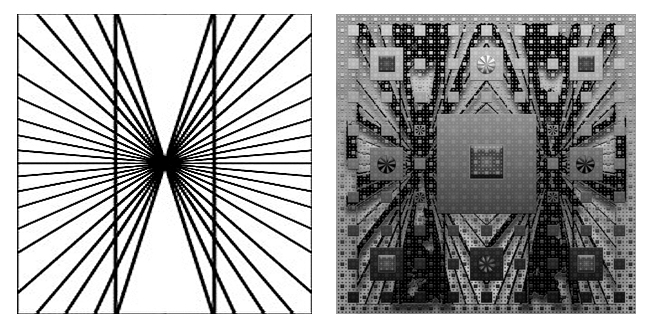
| Considered the founder of experimental psychology, Wilhelm Wundt introduced cognitive principles to the psychology community in the late 1880s. He was the first one to report on the phenomenon. He reported first the overestimation of the subtense of acute angles and the underestimation of obtuse ones. | (Fig.12) |
|
|
| In homage to Robert Grant Aitken astronomer, director of the Lick observatory and president of the University of California. Concentrating on the wheel center for a few minutes will make the wheel spin. | (Fig.13) |
|
|
| Identical objects are perceived as unequal in size when they are surrounded by objects of a different size. This kind of assimilation illusion is also associated with the name of Franz Joseph Delboeuf, a Belgian philosopher. The copies of the same shape - circles and rings in this case - appear to inherit properties of their environment. Two equal circles - one inside a bigger circle, the other containing a smaller circle - seem to have different sizes. |
(Fig.14) |
III - COLOR |
|
| In the early 1900's, Johannes Itten, color instructor at the Bauhaus and trained in psychoanalytic theory developed a color wheel that took into consideration the subjective feeling that's associated with objective color, and the psychic and emotional values of colors. | |
| I used Itten’s color wheel as a reference for various previous works and thought it would be fitting to expand my project to include another layer of manipulation inspired by one of the great figures of the early 1900 | (Fig.15) |
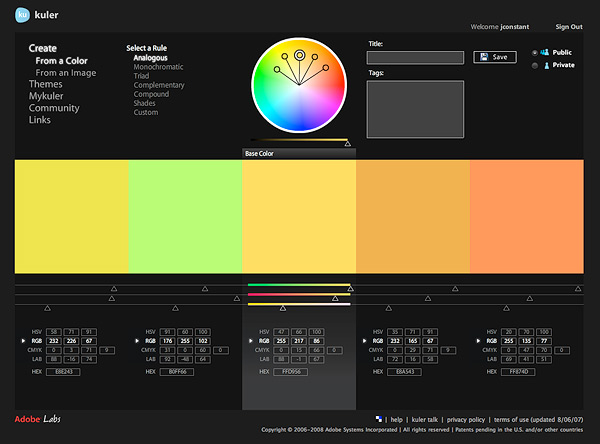
| My work was made considerably easier by a fairly recent tool made available by the Adobe Lab, the Kuler web hosted application that allows you to create and test color combinations in real time. | (Fig.16) |
| Working in separate layers, I was able to incorporaate and blend in the artwork the color schemes I found most effective. | |
| Below is an example of the progression from black & white to color: | |
 |
(Fig.17) |
CONCLUSION |
|
| 21 original digital plates, resolution 300 pixel per inch, dimension15x15 inches were completed. The final prints, size 22x22, signed by the author and numbered 1-10, are available on fine art, museum quality archival paper. | |
ACKNOWLEDGEMENT |
|
| I would like to express my deep and sincere gratitude to the following: Dr. Anders Pelander, Dr. Ruby Lathon, Ulrich Niemeyer, Roland Piquepaille, Lokesh Dhakar, Alessandro Fulciniti, Brigitte Furst, Steve Wold and the many other who provided inspiration, advice and technical guidance. | |
| This project could not have been completed without their help and support. | |
REFERENCES |
|
[1]Anders Pelander. A Study of Smooth Functions and Differential Equations on Fractals. Department of Mathematic, University of Upsalla, Sweden. |
|