Jean Constant
Stochastic Art |
|
Following is some information about the technical background of the images in the gallery. Each composition incorporates elements of randomness, after effect images and other optical effects that viewers may or may not experience at the same level or with the same intensity because of the complexity of the eye - to - brain coordination network , which is after all at the core of random variable in the perception of reality.
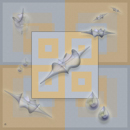
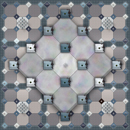
1. Solitons on an abstract background. Gray and gold squares have the same exact value. This design owes much to Joseph Albers who studied at length the physical perception of color. The stochastic process starts with the question - believing vs seeing, rational vs perceptual: knowing grey and gold are of the same value, how long can one agree with the objective data vs receiving different (color value) signals depending on the size and the placement of each square?
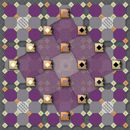
2. Color perception and randomness based on a study by psychologist Kurt Koffka in the early 1900. Background colors have the same value. The black & white rectangle interferes with their objective perception. How long can the brain retain and project the objective information before being confused by the optic signal and amount of light sent by the eye?
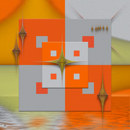
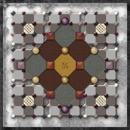
3. Randomness on a two color square variation. Soliton are self contained solitary waves studied in mathematics, physics and music to help understand and assess randomness and stochastic processes. Example of it in nature can be observed in nonlinear shallow ocean-wave - (bottom part of the illustration). Also, in this image, colors have the same value in each of the 3 squares. The upper right corner line of solitons on the middle ground square are positioned according to the chord ”Adelaide” from Beethoven’s famous song for solo voice and piano
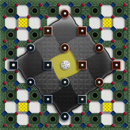
4. Random perception. Based on a convex object built after German physiologist L. Hermann . I f you look at the tori rings, chances are black spot will appear in most white circles, never at the same place and for the same length of time. How long will the viewer sustain the effect depends on various random elements having to do with visual alertness and image retention ability.
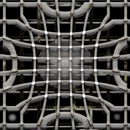
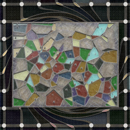
5. Hermann grid variation on a concave object. The effect subsides and is better defined when the viewer concentrates on the representation of the central conformal map motive. Conformal mapping is a mathematical technique used to convert one mathematical problem and solution into another.
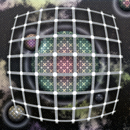
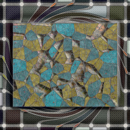
6. Study of the Hermann grid in a colored environment. Random perception of spots appear in the central yellow circles that can be blue or red. The central conformal map regression with a Droste effect serves as the focus point from which the effect will take place. The question this time is not only will the viewer see the spots and for how long but also what color will they be?
7. Herman and Levy. After a series of templates from Dr. R. Levy's work on double stochastic effect. R. Levy recorded brain activities during experimentally induced state changes in sound perception varying according to wakefulness. The idea is to use a finite representation of a stochastic process and blend in elements of randomness that the viewers will experience in real time from the Hermann's grid optical interference. Black spot and/or after effect colors appear and disappear randomly in the outer white circles.
8. Hermann & Levy - Step 2 from template #4
9. Hermann & Levy - Step 3 from template #7
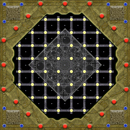
10. The shortest route problem (recursive method). After a model used by Evan L. Porteus to demonstrate the recursive methodology in stochastic problem solving.
A. Setting the problem - 4 square x 4 squares - calculate the shortest route from 1 to 16. The image is the same grid represented 3 times at a different size. The randomness effect appears as the eye attempt to fill black circle with white dots and white circles with white dots. Also the white circle in the single black square in the lower right side is 100% pure white. How much time does it take for the eye to assimilate the objective information (pure white) and compensate what looks like to be a slightly red-brownish circle?
B. The problem is solved using the recursive method. the central nodes are supported by a shifting table to emphasize the use of arcs, not lines, to calculate the shortest route. The shortest distance from node 1 to 16 is 15 (slightly highlighted) and the shortest route is along node 1-3-6-10-13-15-16. The random effect is the eye evaluation of the central grid: it is above or under the (smaller square size) background? And how long does the eye retain the conflicting data between light and shade that create the confusion? There is also a slight after-image effect in the white vs black squares.
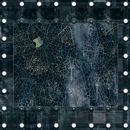
11. The shortest route problem (Stochastic calculation). After an optimization model by Evan L. Porteus
A. Chance elements are introduced in the design: decision nodes are square, the stochastic nodes are spherical.
B. Solving the problem - The minimum expected distance is 21. hinted on the image by a slightly larger sphere left edge corner
Background image: Planet Mars, courtesy of the HIRISE project.
|